It's true, I think sorting algorithms are cool, and not only because I'm a huge, massive nerd who sometimes spends weekend evenings coding for fun. I think they're cool because they're one of the places where the theoretical side of computer science can almost be concretely realized.
Visualizations of sorting algorithms not only make the process easier to grok, they sometimes look really cool. I like things like the Mandlebrot set because it's beauty from a totally theoretical source. By providing a simple set of rules for how the output should display and letting the computation run its course, one can create art.
So, when Grinnell's CS department decided started looking for a new logo, and John Stone brought up the idea of sorting a list of colors visually, I immediately liked the idea. Two Grinnell students, David D'Angelo and Soren Berg, had spent the summer implementing a Scheme console in Inkscape, and had recently given a very impressive presentation on their work. So I decided to give the idea a go with Inkscape and Scheme.
The resulting code can be found here. I tried to stick close to the functional paradigm, so you end up passing in a bunch of functions: most importantly, a function which takes a list and performs one "round" of sorting on it. In the examples here, I've tried to use "rounds" that take roughly n time. So with the simpler algorithms, it's one pass through the list. With quicksort, it's picking one pivot and moving everything else to one side or the other. And so on.
A visualization of mergesort that I made with this has been accepted as the new Grinnell CS logo, and will presumably be making an appearance on the website sooner or later.
Enough exposition! Let's move on the the results.
Insertion Sort
Well, we had to start somewhere...
Pretty straightforward, no? We start with a randomized list of colors on a gradient between black, Grinnell Red, and white. Each pass, we pull an item off the unsorted group and run through the sorted list to find the right spot for it. It works, and it's simple, but it's kinda dull and pretty slow.
Here's the same sort without the black borders, for your aesthetic enjoyment:

Merge Sort
Now we're talking. O(nlogn), wooooo!
Each black border represents a sorted list (in the beginning, every list of one is sorted, because it only has one element). On every pass we merge these lists by twos, until we only have one list left.
Here's an un-bordered merge sort:

Quicksort
Everyone's favorite fast algorithm that's still O(n^2).
On each pass, a list is split into three lists: an arbitrary pivot, and all items less than and greater than that pivot. You can see divide and conquer at work here: on the first pass there is just one pivot created. By the second, there are three: the original, and one pivot picked out of each of the sublists. In contrast to merge sort, here it is when we have a plethora of one-item lists that the sort is done.
One without borders:

Bubble Sort
That's right! A very special treat for you all!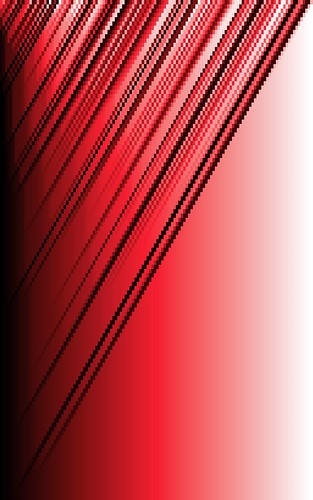
Remember kids, just because it's kinda pretty, doesn't mean it's a good sorting algorithm.
Other Stuff
The cool thing is that now that I have my framework written, it's relatively easy to plug in new ideas. Following are a couple examples that I wrote up just recently.Quicksort on a value-only gradient.

Quicksort on a list across the entire range of hues. The previous examples sorted by a simple sum of the RGB values of each color. For this one, I wrote a new comparator that sorts by the Hue part of HSL and used that for the sorting instead.
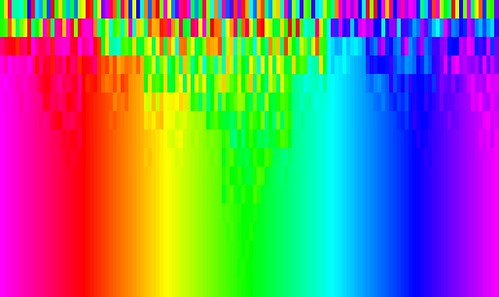
Mergesort on the same list of hues. Yes, I realize these are obnoxiously bright.

Okay! That's all for now. Hope you have enjoyed this, and maybe it's even inspired you to think differently about sorting algorithms for a moment. I may get inspired to mess around with these more in the future, who knows. I feel like this is only brushing the tip of the iceberg as far as the potential of scripting in Inkscape goes. Another promising route is to use David and Soren's library of transformation functions to do cool things to the items in the lists after they've been created, or in relation to their stage in the sorting cycle. And this list-based approach could probably be applied to things besides sorting. I'm off to research entropy...


1 comment:
Very nice way of visualizing sorts .
For learning purposes , also take a look at :
http://www.thelearningpoint.net/computer-science
( Java applet visualization for popular sorting algorithms - Bubble sort , merge , quick , insertion , shell sort )
Post a Comment